
Family trees are like Ore graphs: everyone has two parents, and no one is their own ancestor.
In my most recent post here on Mafia Genealogy, about the hierarchy of a Mafia “Family,” or cosca, I briefly demonstrated the utility of network science in understanding how the Mafia is organized.
An extended family can be understood as a kind of social network, one that operates under special limitations. For example, while in many kinds of social networks, people can have an unlimited number of relationships of any sort, in a network diagram of a 19th Century person’s ancestors, each person has two and only two parents (though one or both may be unknown to us). In most social network visualizations there is the understanding that it is a snapshot in time, and everyone in the network is in stable, synchronous contact, whereas in most family trees there is a chronological axis, with generations being the rough and overlapping unit of time.
For an endogamy and pedigree collapse experiment I’m conducting, one of the tests I’m running on both the Mafia and control subjects is to look for the shortest paths between two (and among three or more) members through direct descent. I hypothesize that Mafia subjects are more closely related to one another than a random set of people born in Corleone in the same years. To measure that, I’m creating family trees and counting the people in them.
Rendering a family tree as a kind of graph with special rules is both complicated and limited. Converting family trees to data sets lets you take really big sets of relationships and perform calculations on them. There is social network analysis software that lets you visually analyze your data, calculate and rank shortest paths, and find clusters and central figures. I’m working with a relatively small data set, and wanted to understand how the SNA apps do what they do, in this case, to know if I’m counting nodes correctly. My intuition told me that I needed to include the parents of each node in a path, but I didn’t know why that was the right answer.
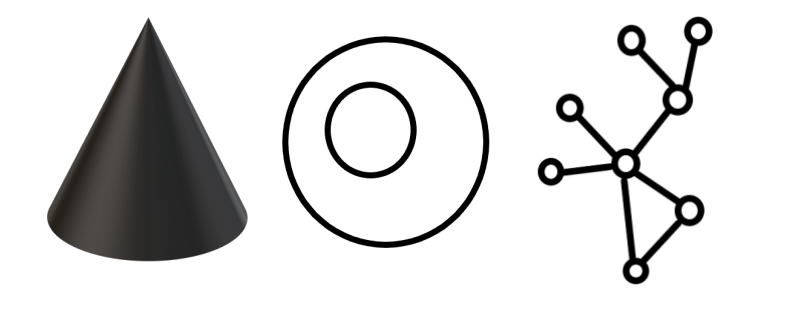
I found a recent, scholarly article by Bokhare and Zainon (referenced below) that reviews family tree visualization software and describes the three kinds of graphs that are used: the Ore graph, the p graph, and the bipartite p graph. To get a sense of what they capture and how they differ, I converted this family tree into three kinds of graphs.
The horizontal bar that links parents to their children in a typical family tree can be considered a node, and in some graphing methods, it is. One way or the other, you have to solve for the problem of where nodes come from. Where do babies come from in flatland, where babies are vertices in a graph? A node doesn’t come directly from another node; it comes from the union of two nodes, which is itself a different kind of node, or you construct the universe such that every node has two ancestral arcs (one of the conditions of an Ore graph).
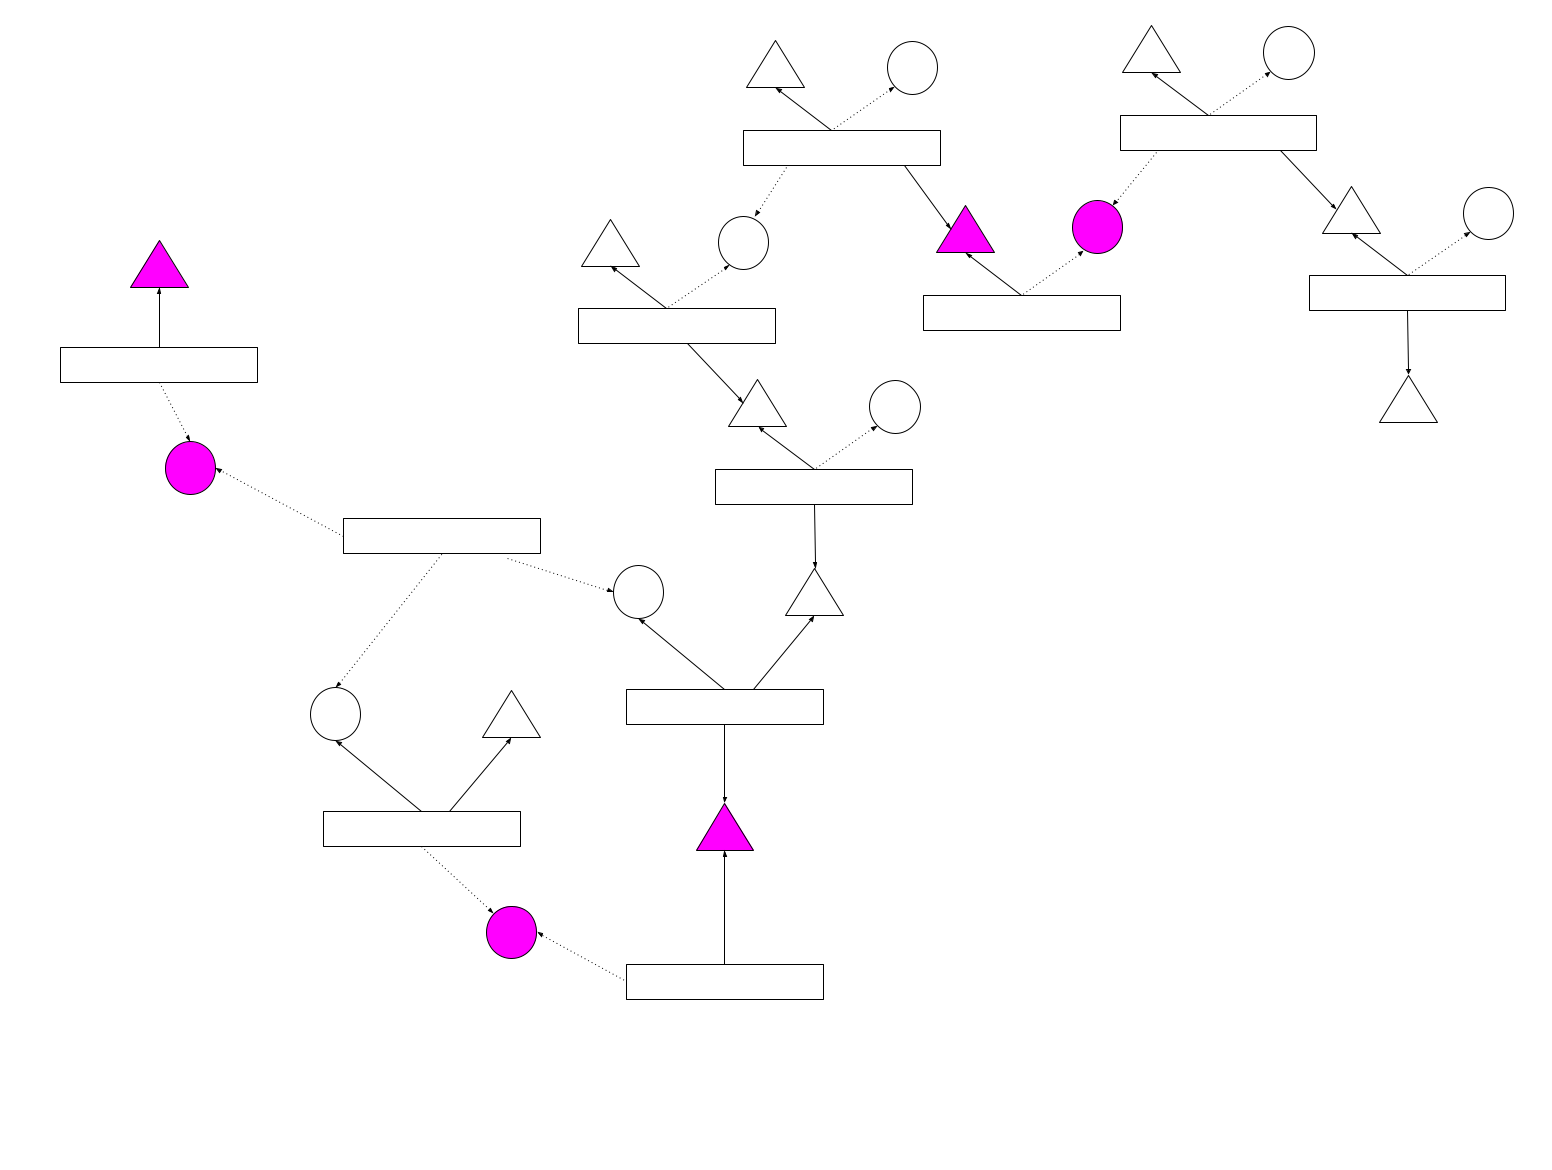
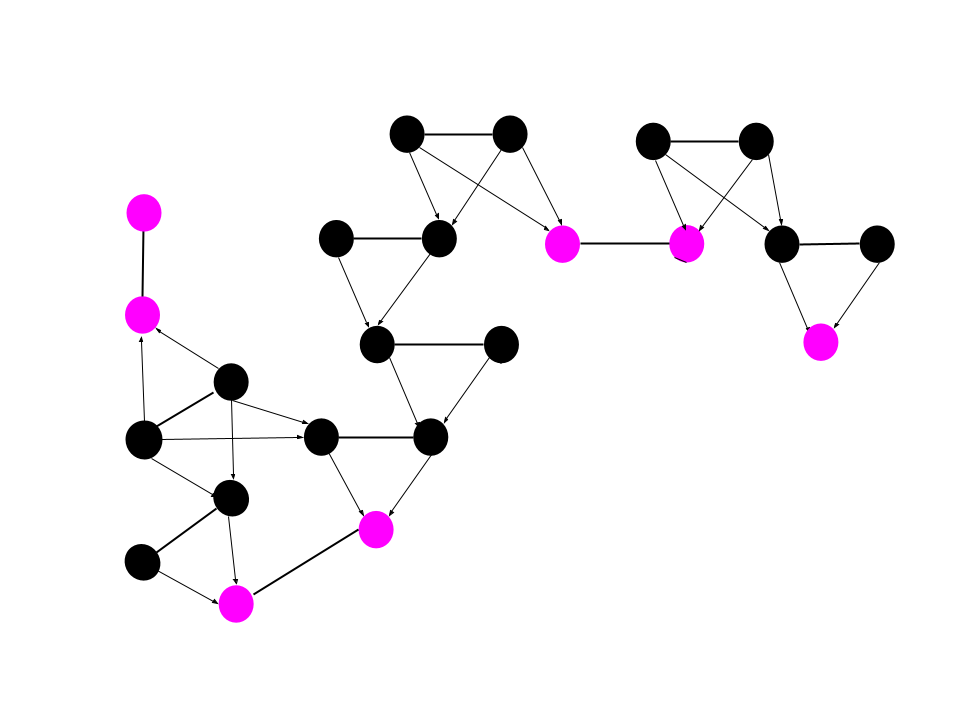
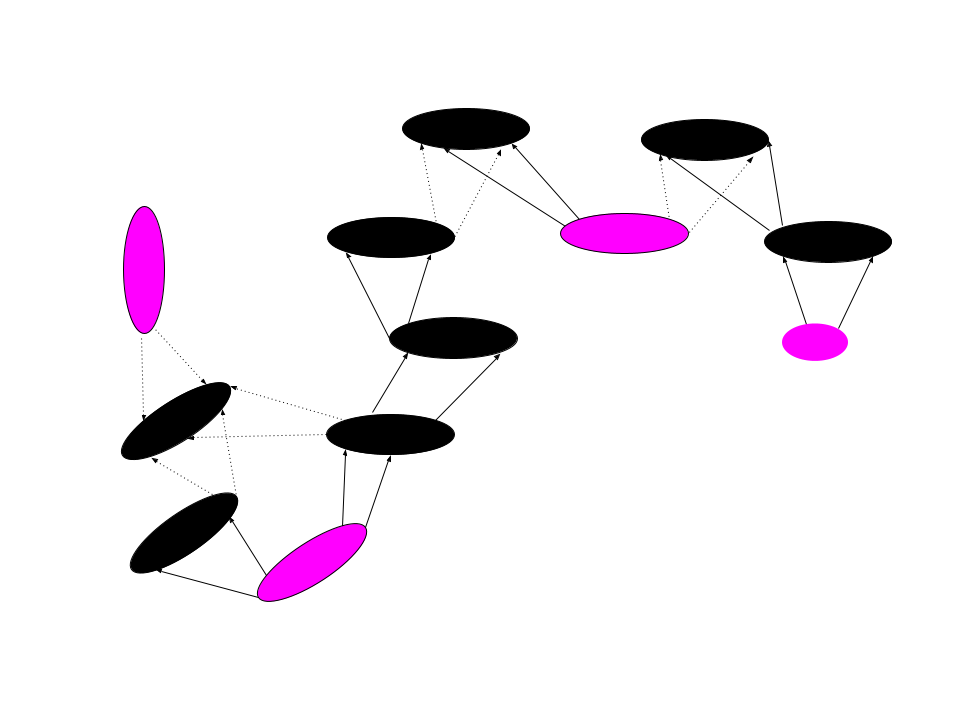
Between the two methods of turning a family tree into a process graph (or p graph), one of them treats a reproductive union as a node which contains the parents, and the other creates two different kinds of nodes, one for each of the parents and one for the union that gives rise to their descendants. Parents and children are related to the unions with arcs going in different directions: pointing into the marriages they create, and pointing out of the marriages from which they were born.
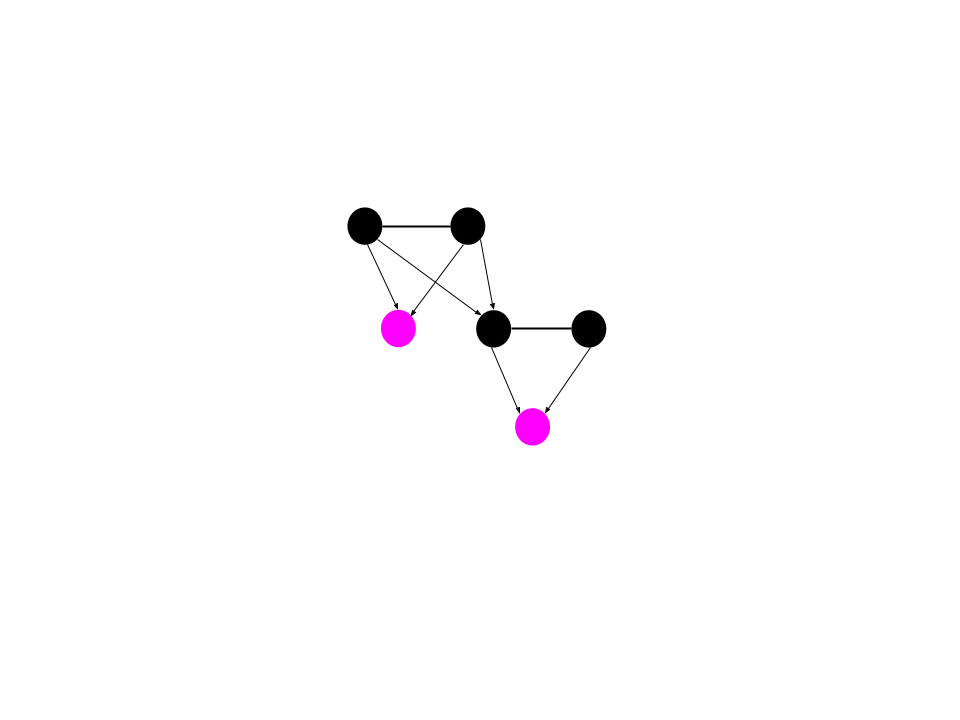
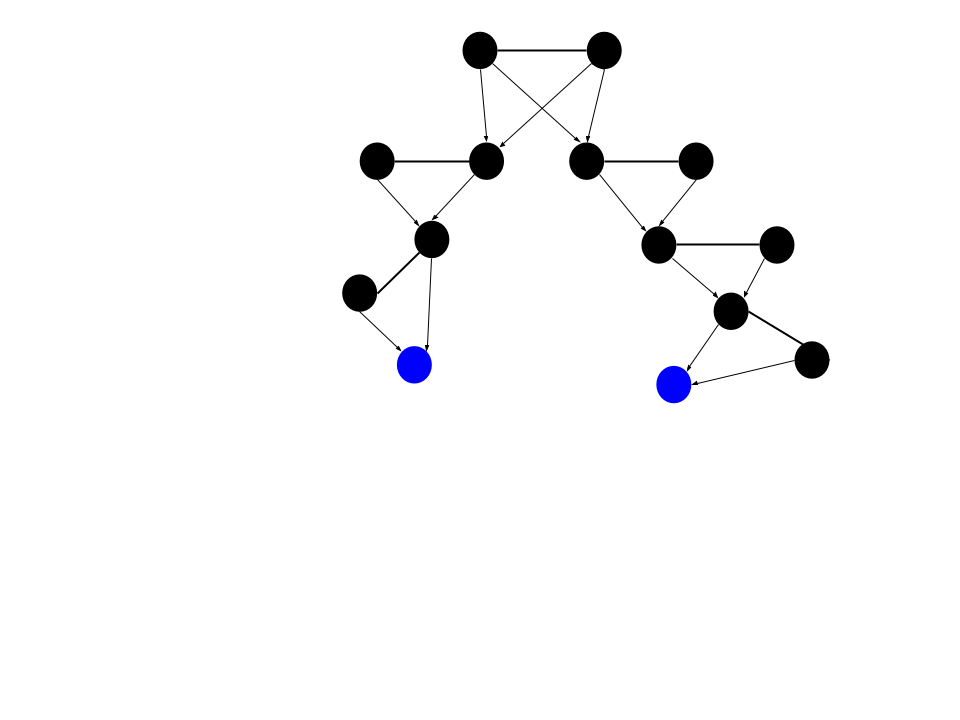
There are more nodes in a bipartite p graph than in any of the other models, but I don’t think it aids understanding of distances between people in a social network to include them. An Ore graph has the same number of nodes as a family tree, but it doesn’t have an orientation corresponding to generations. Ore graphs and family trees have the same number of nodes, provided I follow the rule that each node in a path I measure has to include both parents of the node. With that caveat, I can treat a family tree as a kind of Ore graph.
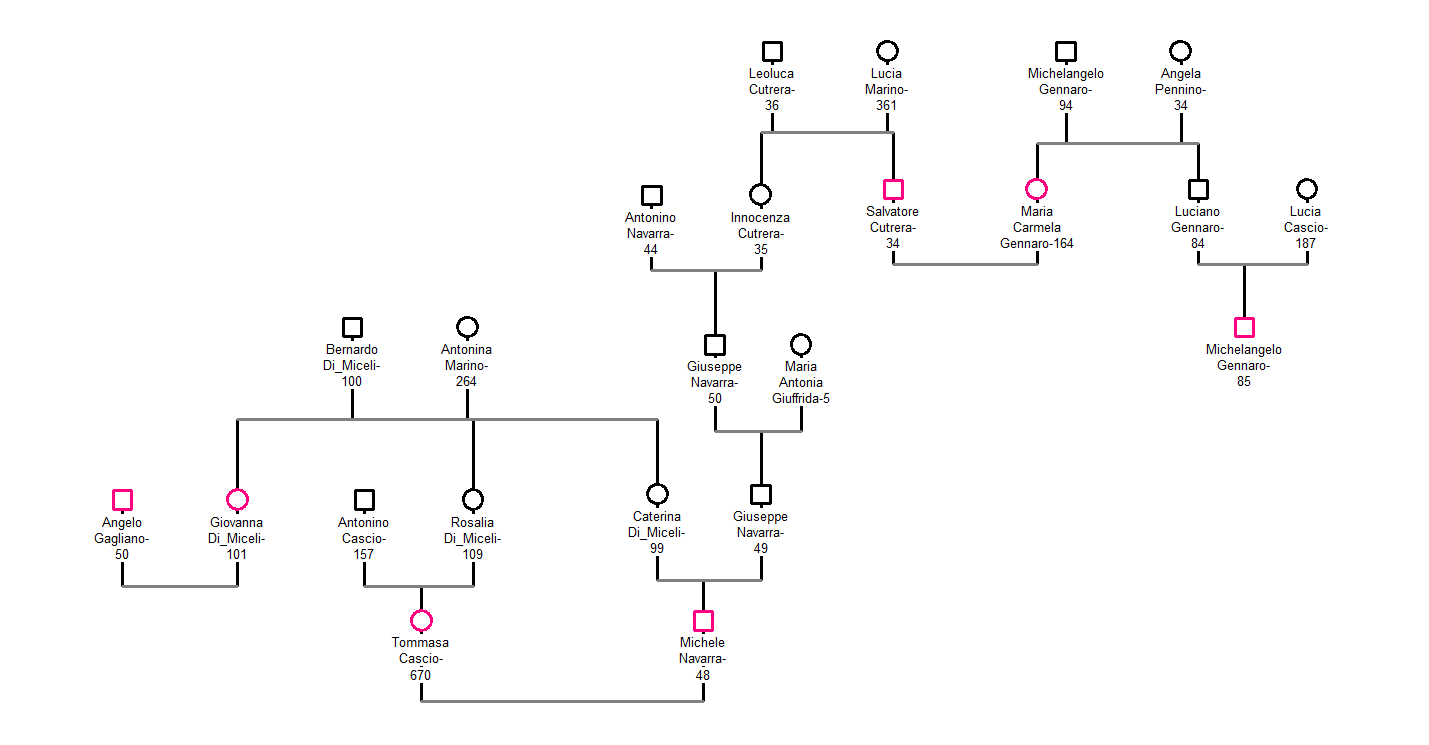
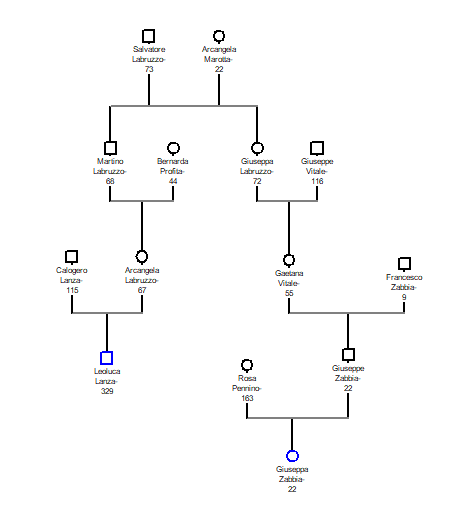
This is a family tree containing 23 nodes, which includes seven Mafia subjects, six of them related through direct descent. A subset of this tree containing just nine nodes has three Mafia subjects. Another subset of this tree with ten nodes has four Mafia subjects.
Not counting subjects related through marriage, the smallest tree containing two Mafia subjects has six nodes.
Out of 15 controls born in Corleone in the same years as my Mafia subjects, the smallest tree connecting the two most closely related subjects from the control group contains fourteen nodes.
Finding the smallest possible tree containing three control group members is more of a challenge. The only other control group member with a duplicate great-grandparent isn’t related to either of the two most closely related members. The next closest ancestor links the same two control group members.
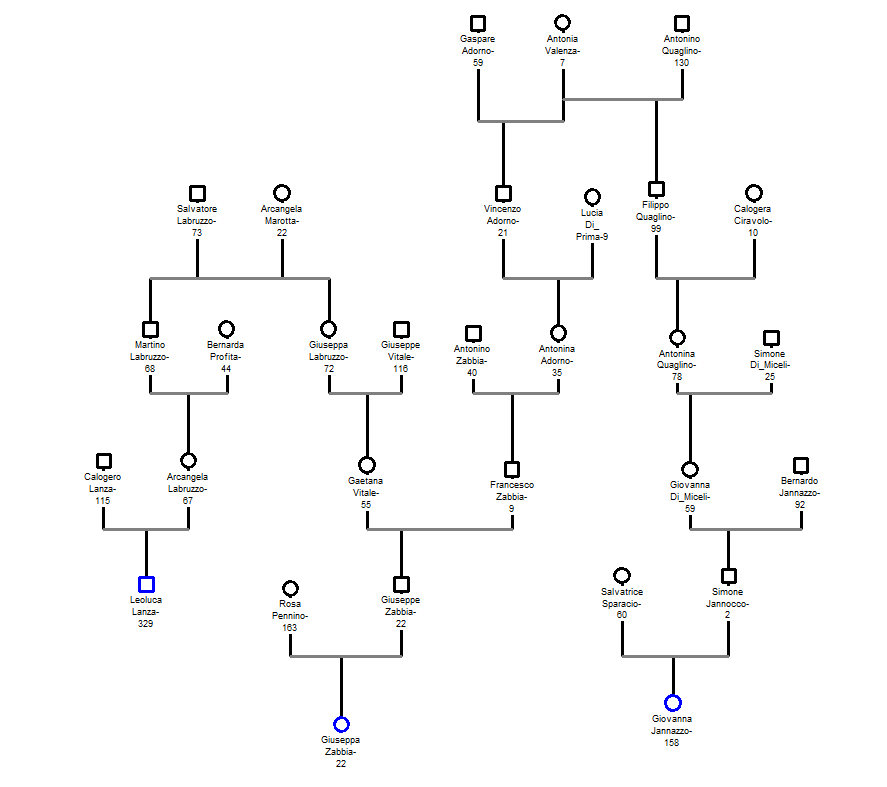
Instead of focusing on the shortest distances to a common ancestor, I looked for other controls who shared an ancestor with either of the two most closely related controls, Lanza and Zabbia. Antonia Valenza-7 is the 3GG of both Zabbia-22 and Jannazzo-158. The smallest tree connecting Lanza, Zabbia, and Jannazzo has thirty nodes, more than three times the size of a comparable tree for Mafia subjects.
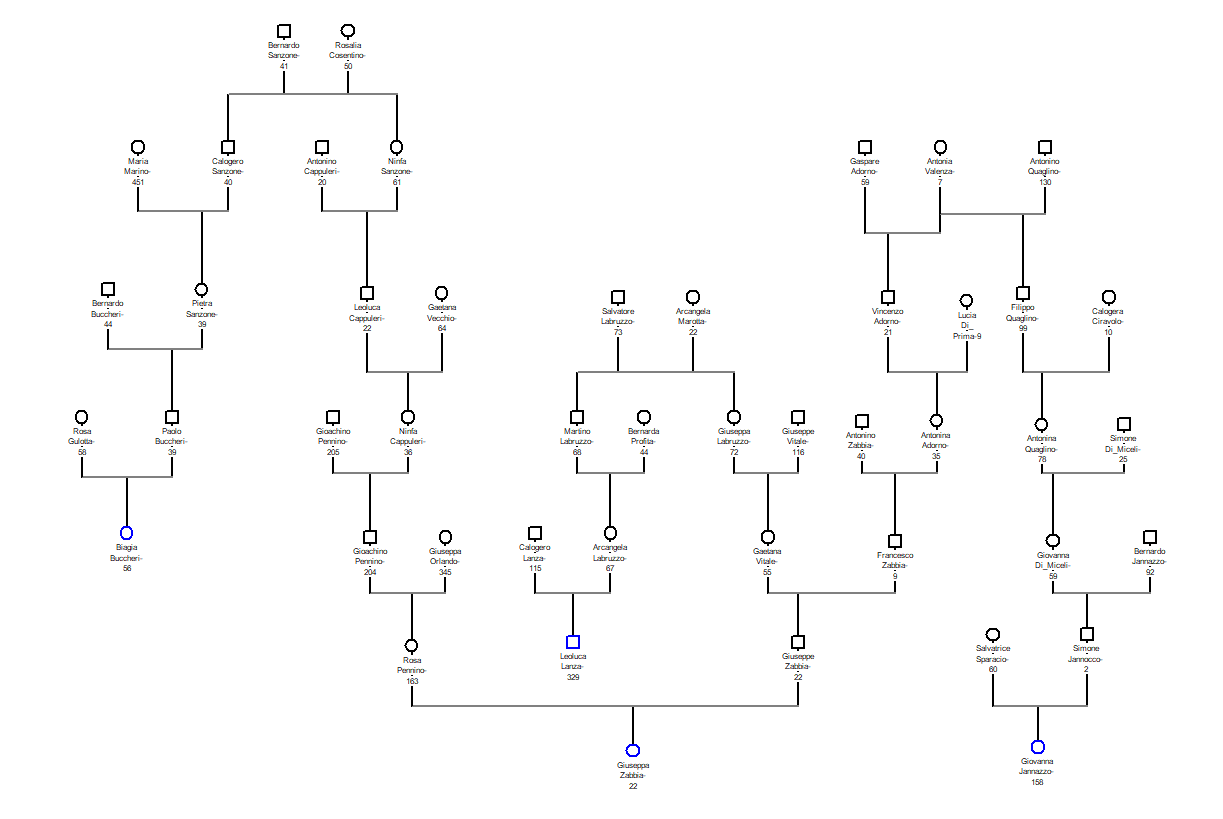
The smallest tree containing Buccheri, Lanza, and Zabbia has 31 nodes.
I’ve known for some time that I could draw a family tree that includes many of the most important mafiosi from Corleone. What my experiment demonstrates is that the family tree containing two, three, or four members of Corleone’s Mafia elite is much smaller than a comparable tree drawn for randomly selected subjects born in Corleone.
The high degree of relation that binds Mafia members and their wives in Corleone is not typical among their unaffiliated peers. Close blood ties through direct descent link the highest levels of Mafia membership in Corleone: to one another and to their wives. Their families have been choosing one another for generations. The result is an endogamous Mafia clan within Corleone.
Acknowledgment
Thom L. Jones tells me that Dr. Michele Navarra’s will named his wife, Tommasa, but no children among his beneficiaries.
Reference
Bokhare, S.F., Zainon, W.M.N.W. (2019, Jan 15). A review on tools and techniques for family tree data visualization. Journal of Theoretical and Applied Information Technology, 96 (1), pp. 121-132.
